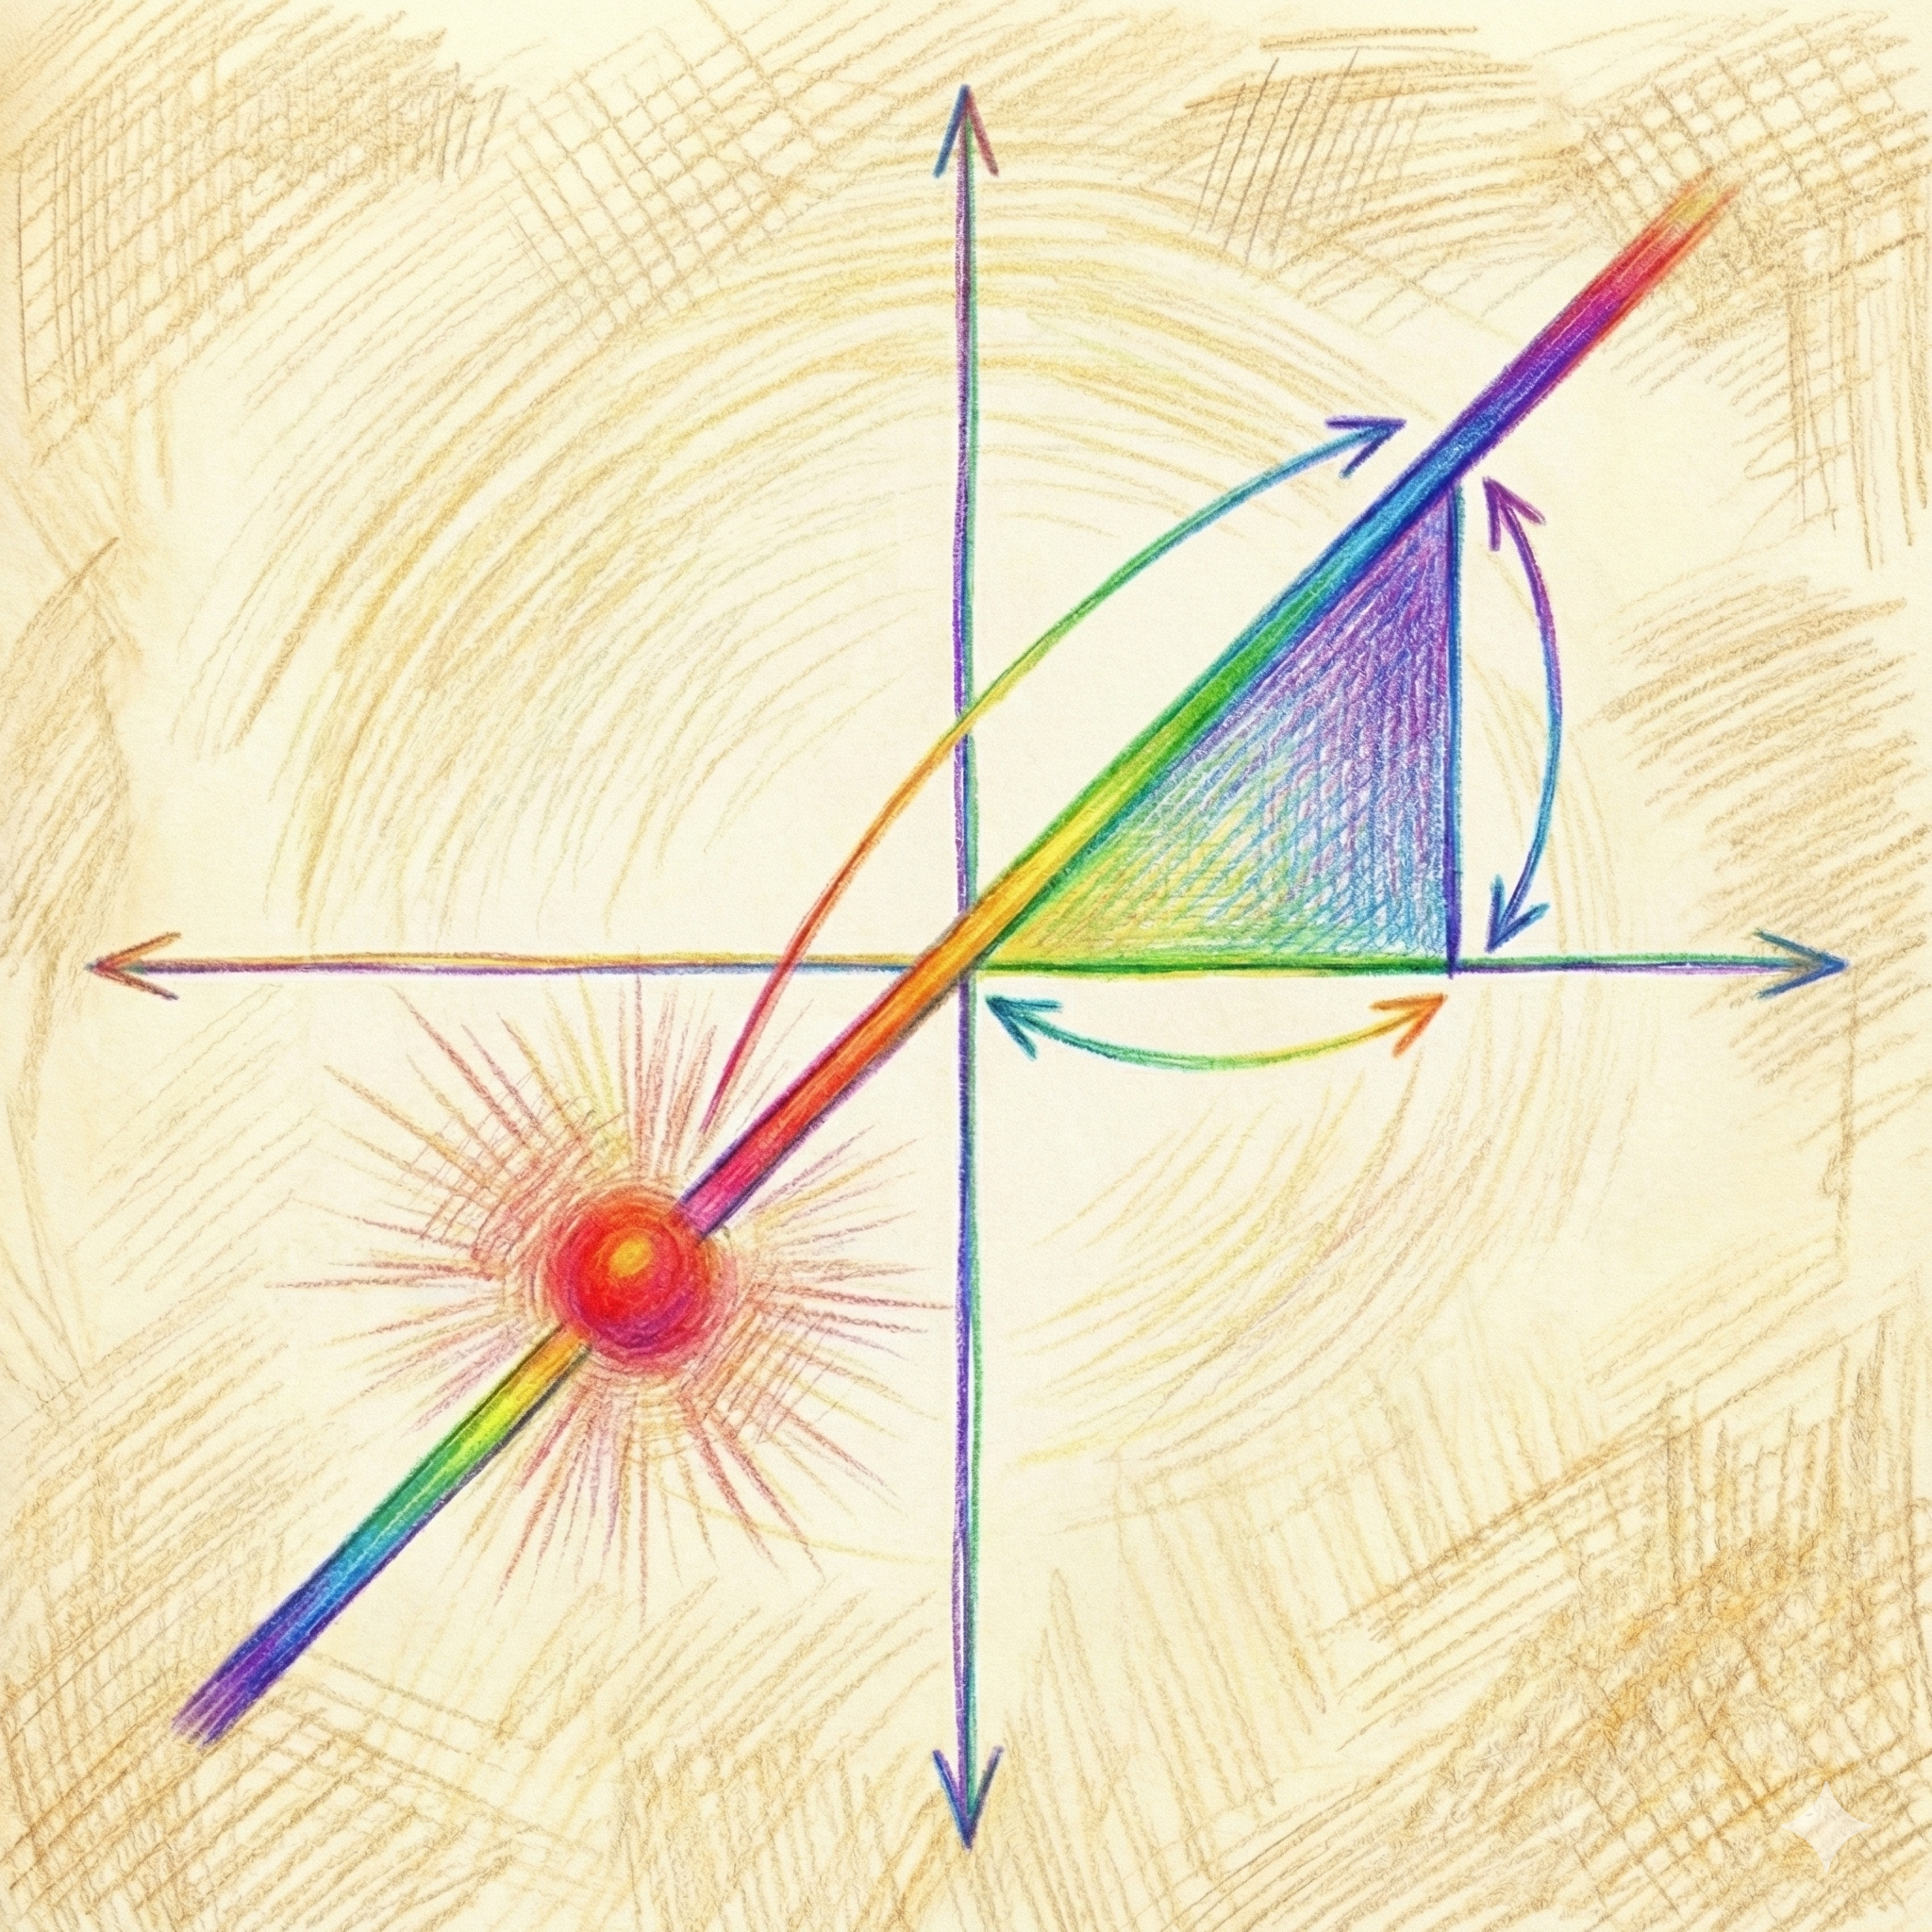
The equation of a straight line is something we’ve known for so long that we often take it for granted. But let’s dust it off and give it a fresh look. Don’t worry, this won’t feel like a boring math class. Think of it as an immersive little adventure (though yes, a pinch of resilience will help!).
Why line matters in ML?
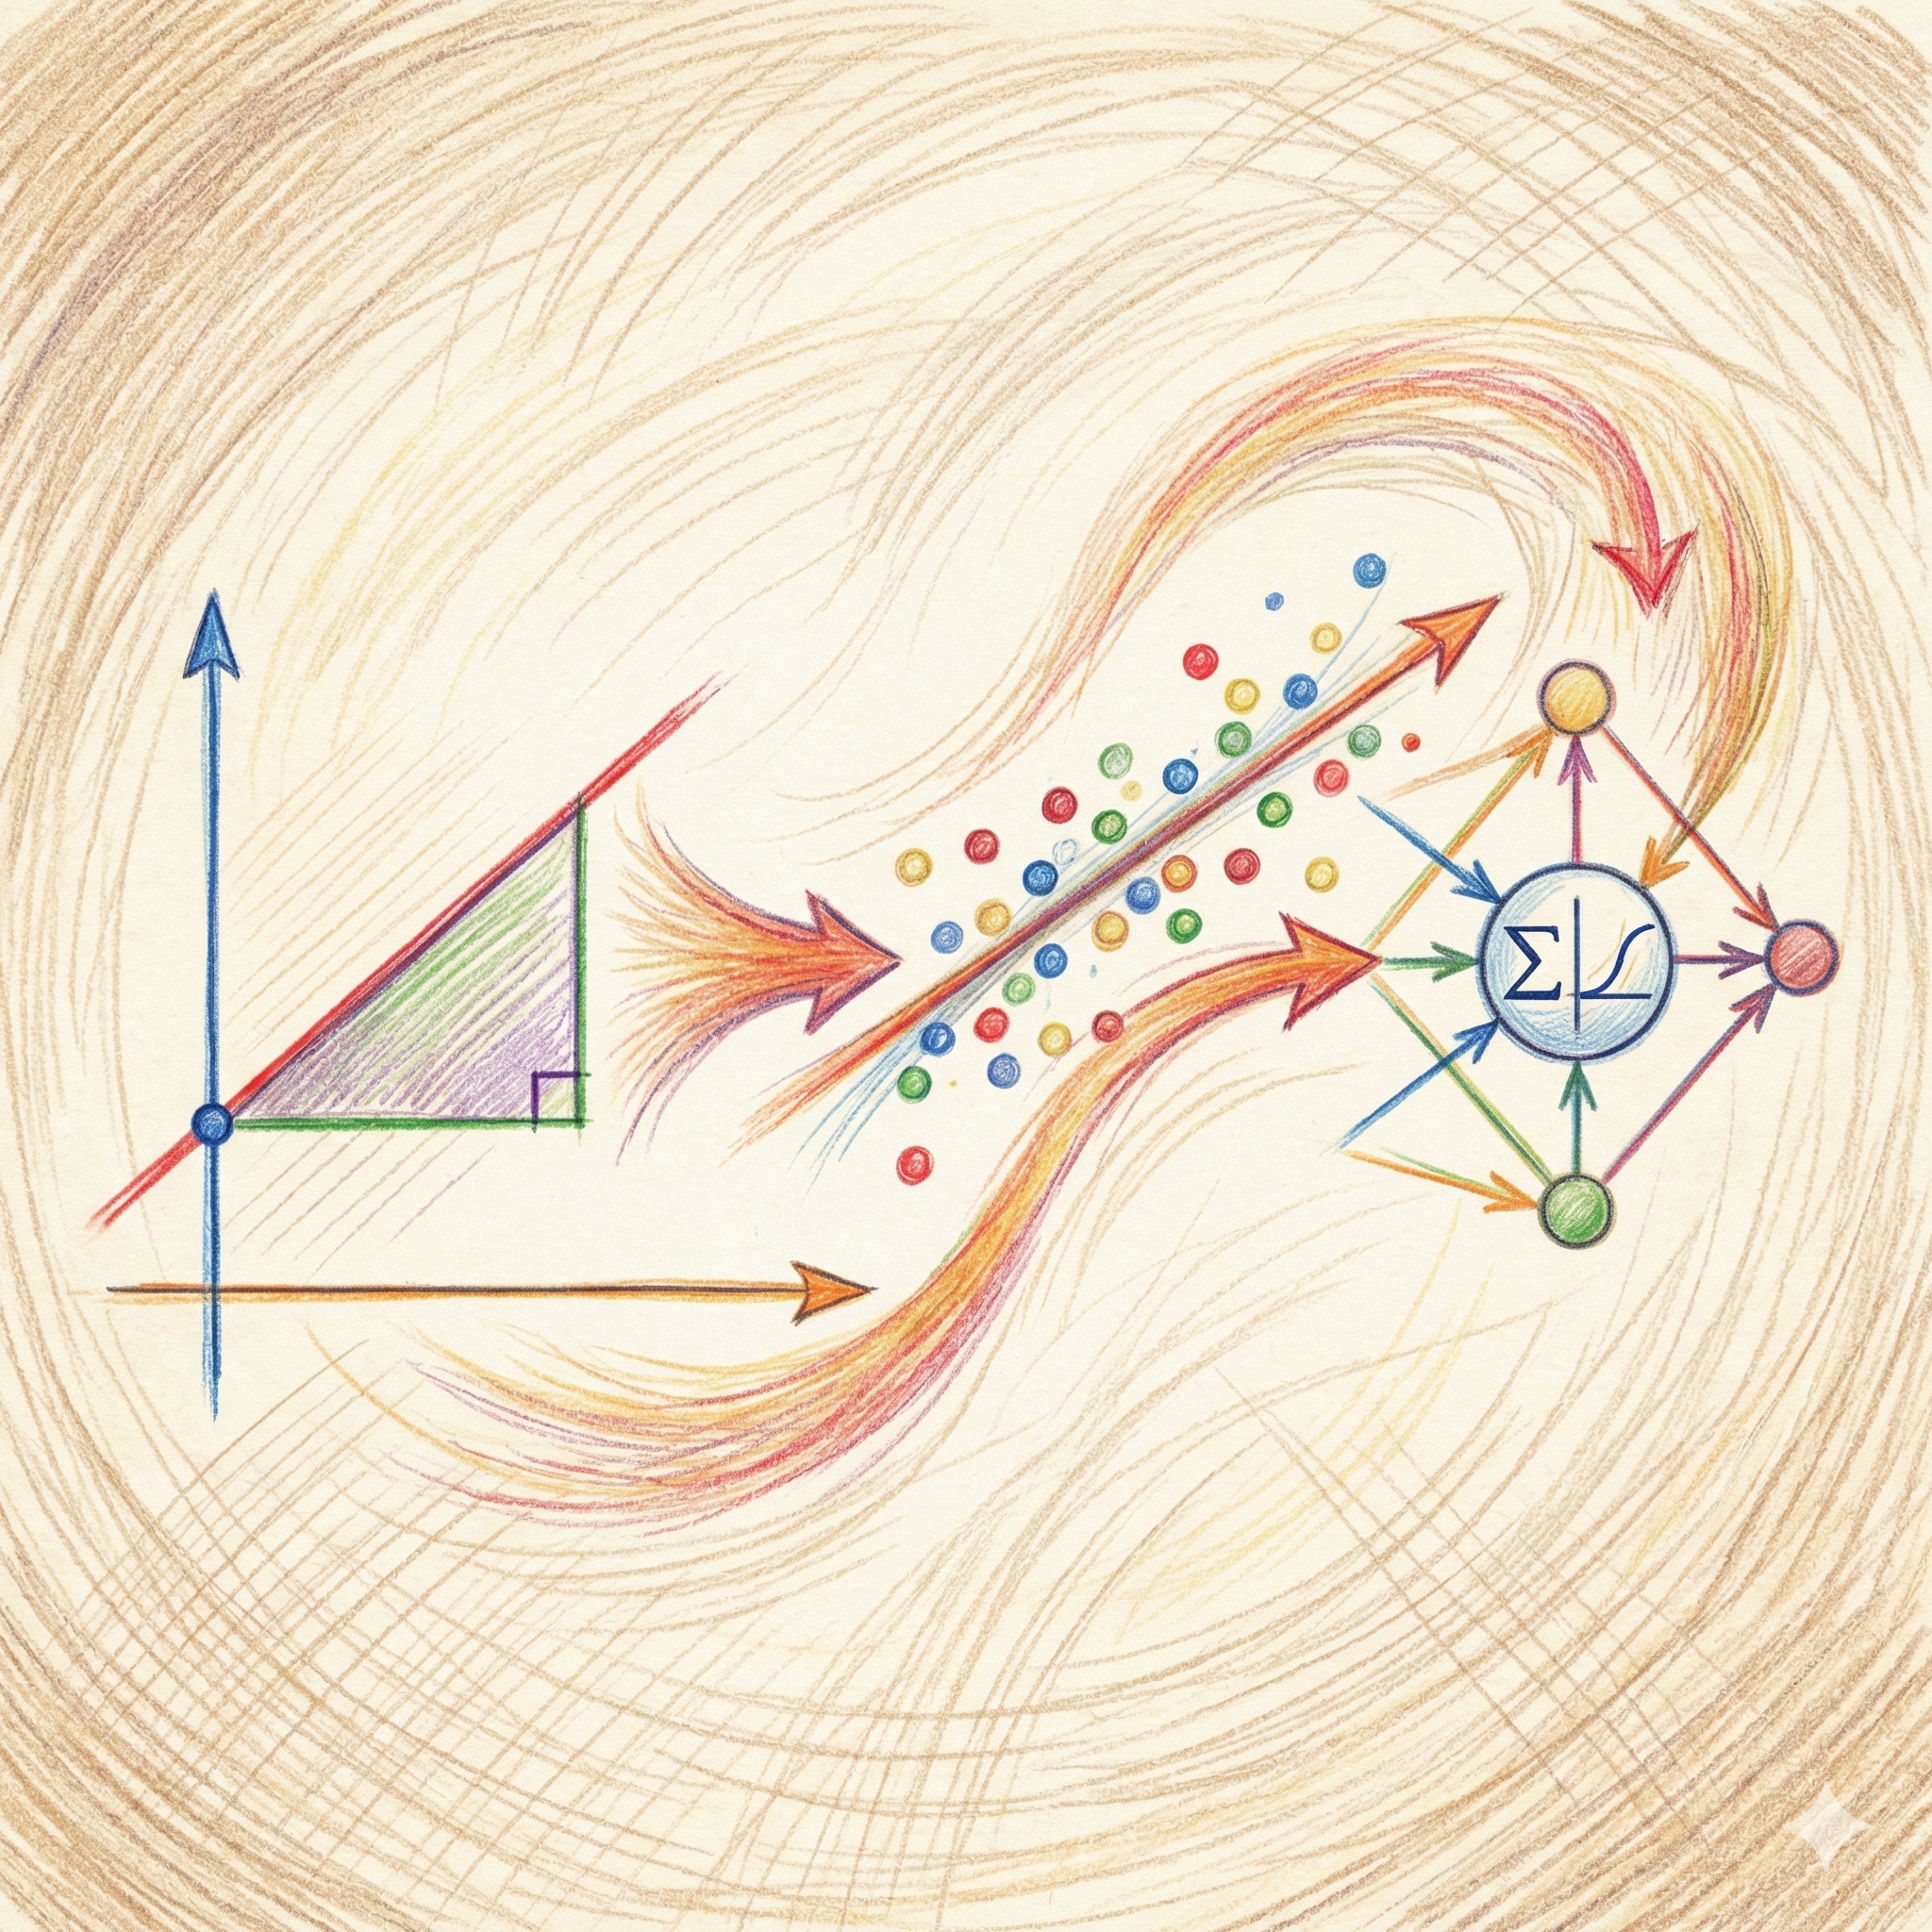
The beauty of maths is that whatever holds true in one dimension can be scaled up to n dimensions. And since machine learning often lives in those tricky-to-visualize n dimensions, the real superpower is a solid grasp of the one-dimensional vector space. Luckily, one dimension is friendly enough to wrap your head around. So here we are, starting with the humble equation of a line—simple on the surface, but surprisingly powerful. In fact, this little concept pops up again and again in some of the most important ML concepts. Let’s have a look.
Linear Regression: Fitting a Line
Linear regression describes the relationship between features and a target variable. In higher dimensions, that ‘line’ can actually be a plane or even a hyperplane. The general form of equation looks like this:
ŷ = w₁x₁ + w₂x₂ + … + wₙxₙ + b
Looks complicated? Well, it’s really just a multi-dimensional extension of the simple equation:
y=mx+b
And that’s the real beauty of mathematics – how simple ideas scale to powerful models.
Optimization: Gradient = Slope
Many experts consider derivatives—especially the chain rule—to be among the most essential tools in the mathematics of machine learning. But here’s the catch: partial derivatives are difficult to grasp without first understanding the concept of a line’s slope. And that slope? It’s precisely what we call the gradient. Gradients are fundamental to optimization; without them, most machine learning models would struggle to learn effectively.
Decision Boundaries in Classification (spam Vs not-spam):
In classification problems, the decision boundary is what separates one class from another. Depending on the dimension, this boundary can be a simple line or a hyperplane. The equation looks like this:
wᵀx + b = 0
At first glance, it may seem fancy, but it’s really just another version of the humble straight-line equation y = mx + b. Think of it as the line’s cooler, multi-dimensional version—the one that solves many classification problems.
Bias (Intercept) vs. Weight (Slope):
You’ll hear these terms a lot—or maybe you’ve already wrestled with them, if you tried learning ML on your own. (If that reopened old wounds, my apologies!) Let’s keep it simple:
Weight (Slope ) decides the tilt or slop of the line.
Bias (Intercept) shifts the line up or down.
That’s it. Nothing scary, just a line gymnastics!
Since linear algebra begins with the line, it only makes sense that our first stop in the ‘Maths for ML’ series is here. A line is a 1D vector space, and without it, concepts like vector projection, orthogonality, and span would be tough to grasp. Master the line, and you’ve laid the foundation for all the fascinating linear algebra ideas ahead.
And that’s where we’ll pause—with the line, the simplest yet most powerful shape in ML. But don’t pack up your maths notebook just yet! In the next article, we’ll chase down the equation of a line—slope, intercept, and all—and see how this unassuming formula sneaks its way into the heart of machine learning. Ready to draw some lines and cross a few boundaries of knowledge at the same time? Next up in Lesson 2, we’ll explore the Equation of a Line in detail—slope, intercept, and all the ML magic they unlock.