As a child, I vividly remember how elders in my family treated the Sunday newspaper as the ultimate source of truth. Whenever someone questioned their claims—whether about politics, health, or the economy—they’d respond confidently, “It was in last week’s paper.”
Some were so devoted to preserving their credibility that they kept clippings tucked away, ready to prove their point at a moment’s notice.
Back then, I didn’t grasp the weight of those assertions. But now, after learning about confidence intervals, I realize how much nuance was missing from those conversations.
The news often presents numbers as if they’re absolute truths. Yet behind every statistic lies uncertainty — a range that tells us how confident we can be in that reported value. If only I’d known that earlier, I might have gently challenged their certainty — not to question journalism, but to introduce a more thoughtful way of interpreting data.
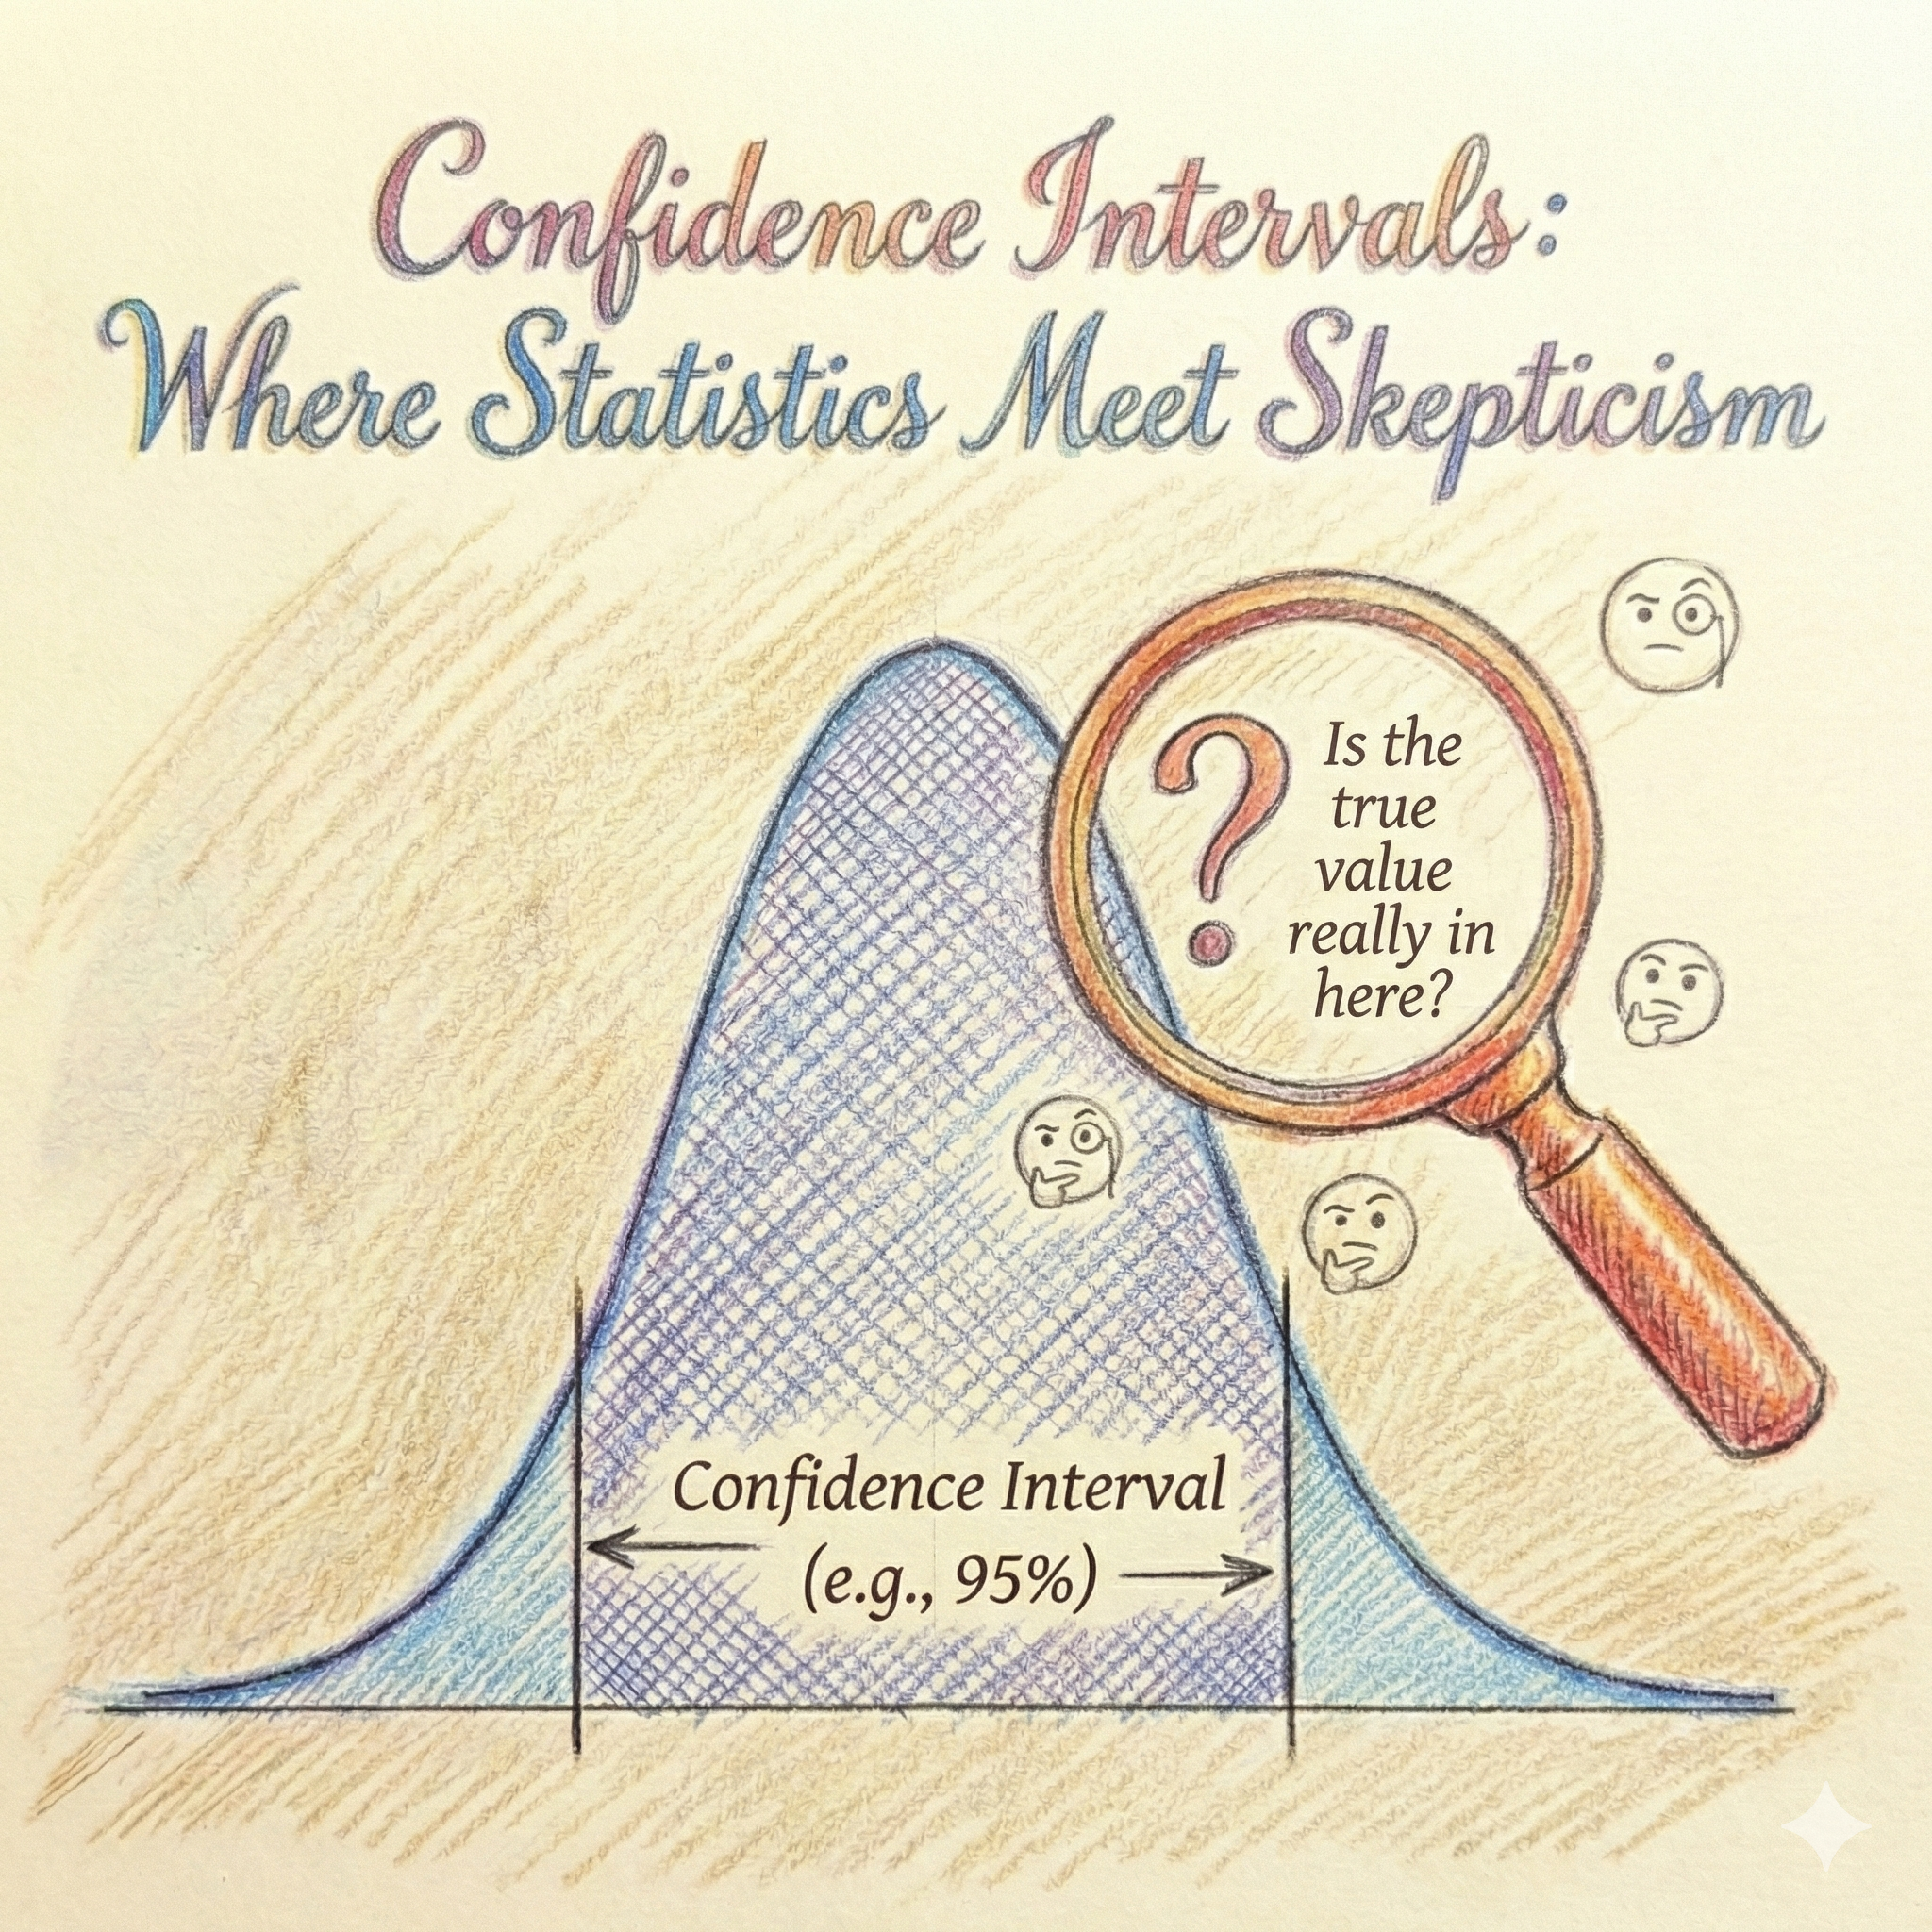
What a Confidence Interval Really Means
A confidence interval expresses uncertainty in numbers. It doesn’t just give us a single value; it gives us a range — a window into how sure we are about that value.
Instead of saying,
“The unemployment rate is 5%,”
A confidence interval might say, “We’re 95% confident it’s between 4.7% and 5.3%.”
That small shift changes everything. It invites us to interpret data not as absolute truth, but as an informed estimate.
Confidence intervals don’t make data less trustworthy — they make it more honest. They remind us that certainty is rare, and that thoughtful skepticism is a strength, not a flaw.
The Intuition Behind Confidence Intervals
A confidence interval is just a way to say:
“Here’s our best guess for the true average, and here’s how much wiggle room we think there is.”
That wiggle room depends on two main factors:
- How spread out your data is — if results vary widely, your estimate is less precise.
- How large your sample is — the more data you have, the more confident you can be.
Example
A health researcher tests a new fish oil with cholesterol support on 200 people to see if it lowers cholesterol. The results are following.
- Average cholesterol drop: 8 mg/dL
- 95% confidence interval: 4 to 12 mg/dL
- In plain language:
“We’re fairly confident the true average drop for everyone using this vitamin lies somewhere between 4 and 12 points.”
So, it’s likely helpful — but the exact amount of benefit is uncertain within that range.
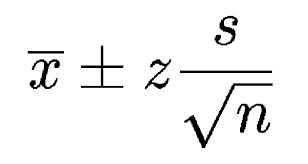
confidence interval formula
Let’s understand the above formula
Sample Mean — “Your Best Guess”
This is just the average from your sample.
Example: If 100 people spend an average of $50, that’s your sample mean — your best estimate of what the whole population might average.
Standard Deviation — “How Much People Differ”
This measures how spread out your data is.
If everyone spends about the same ($49, $51, $50…), the standard deviation is small.
If people vary a lot ($10, $100, $75…), it’s large.
A larger spread means more uncertainty around your average.
Sample Size (n) — “The Power of More Data”
The more people (or observations) you have, the smaller your uncertainty gets.
That’s why we divide by the square root of n.
Doubling your sample doesn’t cut uncertainty in half.
You’d need four times the sample to reduce the margin of error by half.
. z — “How Confident You Want to Be”
The z-value depends on how certain you want to be:
|
Confidence Level |
z-value |
Interpretation |
|
90% |
1.645 |
“Pretty confident” |
|
95% |
1.96 |
“Very confident” |
|
99% |
2.58 |
“Almost certain” |
When you increase the confidence level, you want to be more sure that the true value is inside this interval. It is like casting a wider net to achieve the higher certainty.
More confidence = more caution ! You are being conservative and allow more uncertainty in your estimate, for example, you say at 99% confidence level the average height adult men in Ireland is in range 173 cm to 182 cm, However when you reduce the confidence interval to 90%, you amt say at 90% confidence level the average height of adult men in Ireland is between 175 cm to 180cm. Here, A narrower interval is more precise but less confident, A wider interval is less precise but more confident.
Let’s summarize it with a simple example
Suppose you survey 100 people about how many minutes they exercise per day:
- Mean = 40 minutes
- Standard deviation = 10 minutes
- Sample size = 100
- z for 95% confidence = 1.96
Confidence Interval = [40 – 1.96 x (10/(100)^0.5) , 40 + 1.96 x (10/(100)^0.5)]
Confidence Interval =[ 38.04 , 41.96 ]
So , here we can be 95% confident that the average exercise time is between 38 and 42 minutes.
If I could go back, I wouldn’t challenge my elders’ trust in journalism. However, I might gently suggest that behind every bold statistic is a confidence interval — a quiet reminder that truth in data often comes with margins. Confidence interval reminds us that numbers are not absolute black or white truth but they are measured estimates; May be this is how statistics teach humility!