I have never liked seeing the binomial distribution just as a probability concept. I’ve always wanted to explain it as a pascal’s triangle—how could I ignore the beauty and intelligence of Pascal’s Triangle? And then, algebraically, to make the formulas crystal clear. That’s the thing about math: when you just keep applying it, you get all the answers, but when you try to understand it truly, so many questions arise in your mind! And when you start finding answers to those questions, a kind of comfort develops between you and the concept. It leads you to experiment, overthink, make mistakes, and somehow not feel bad about those mistakes. You begin to feel more at ease with exploring and understanding the idea, rather than simply remembering it or tying your self-worth to your math score.
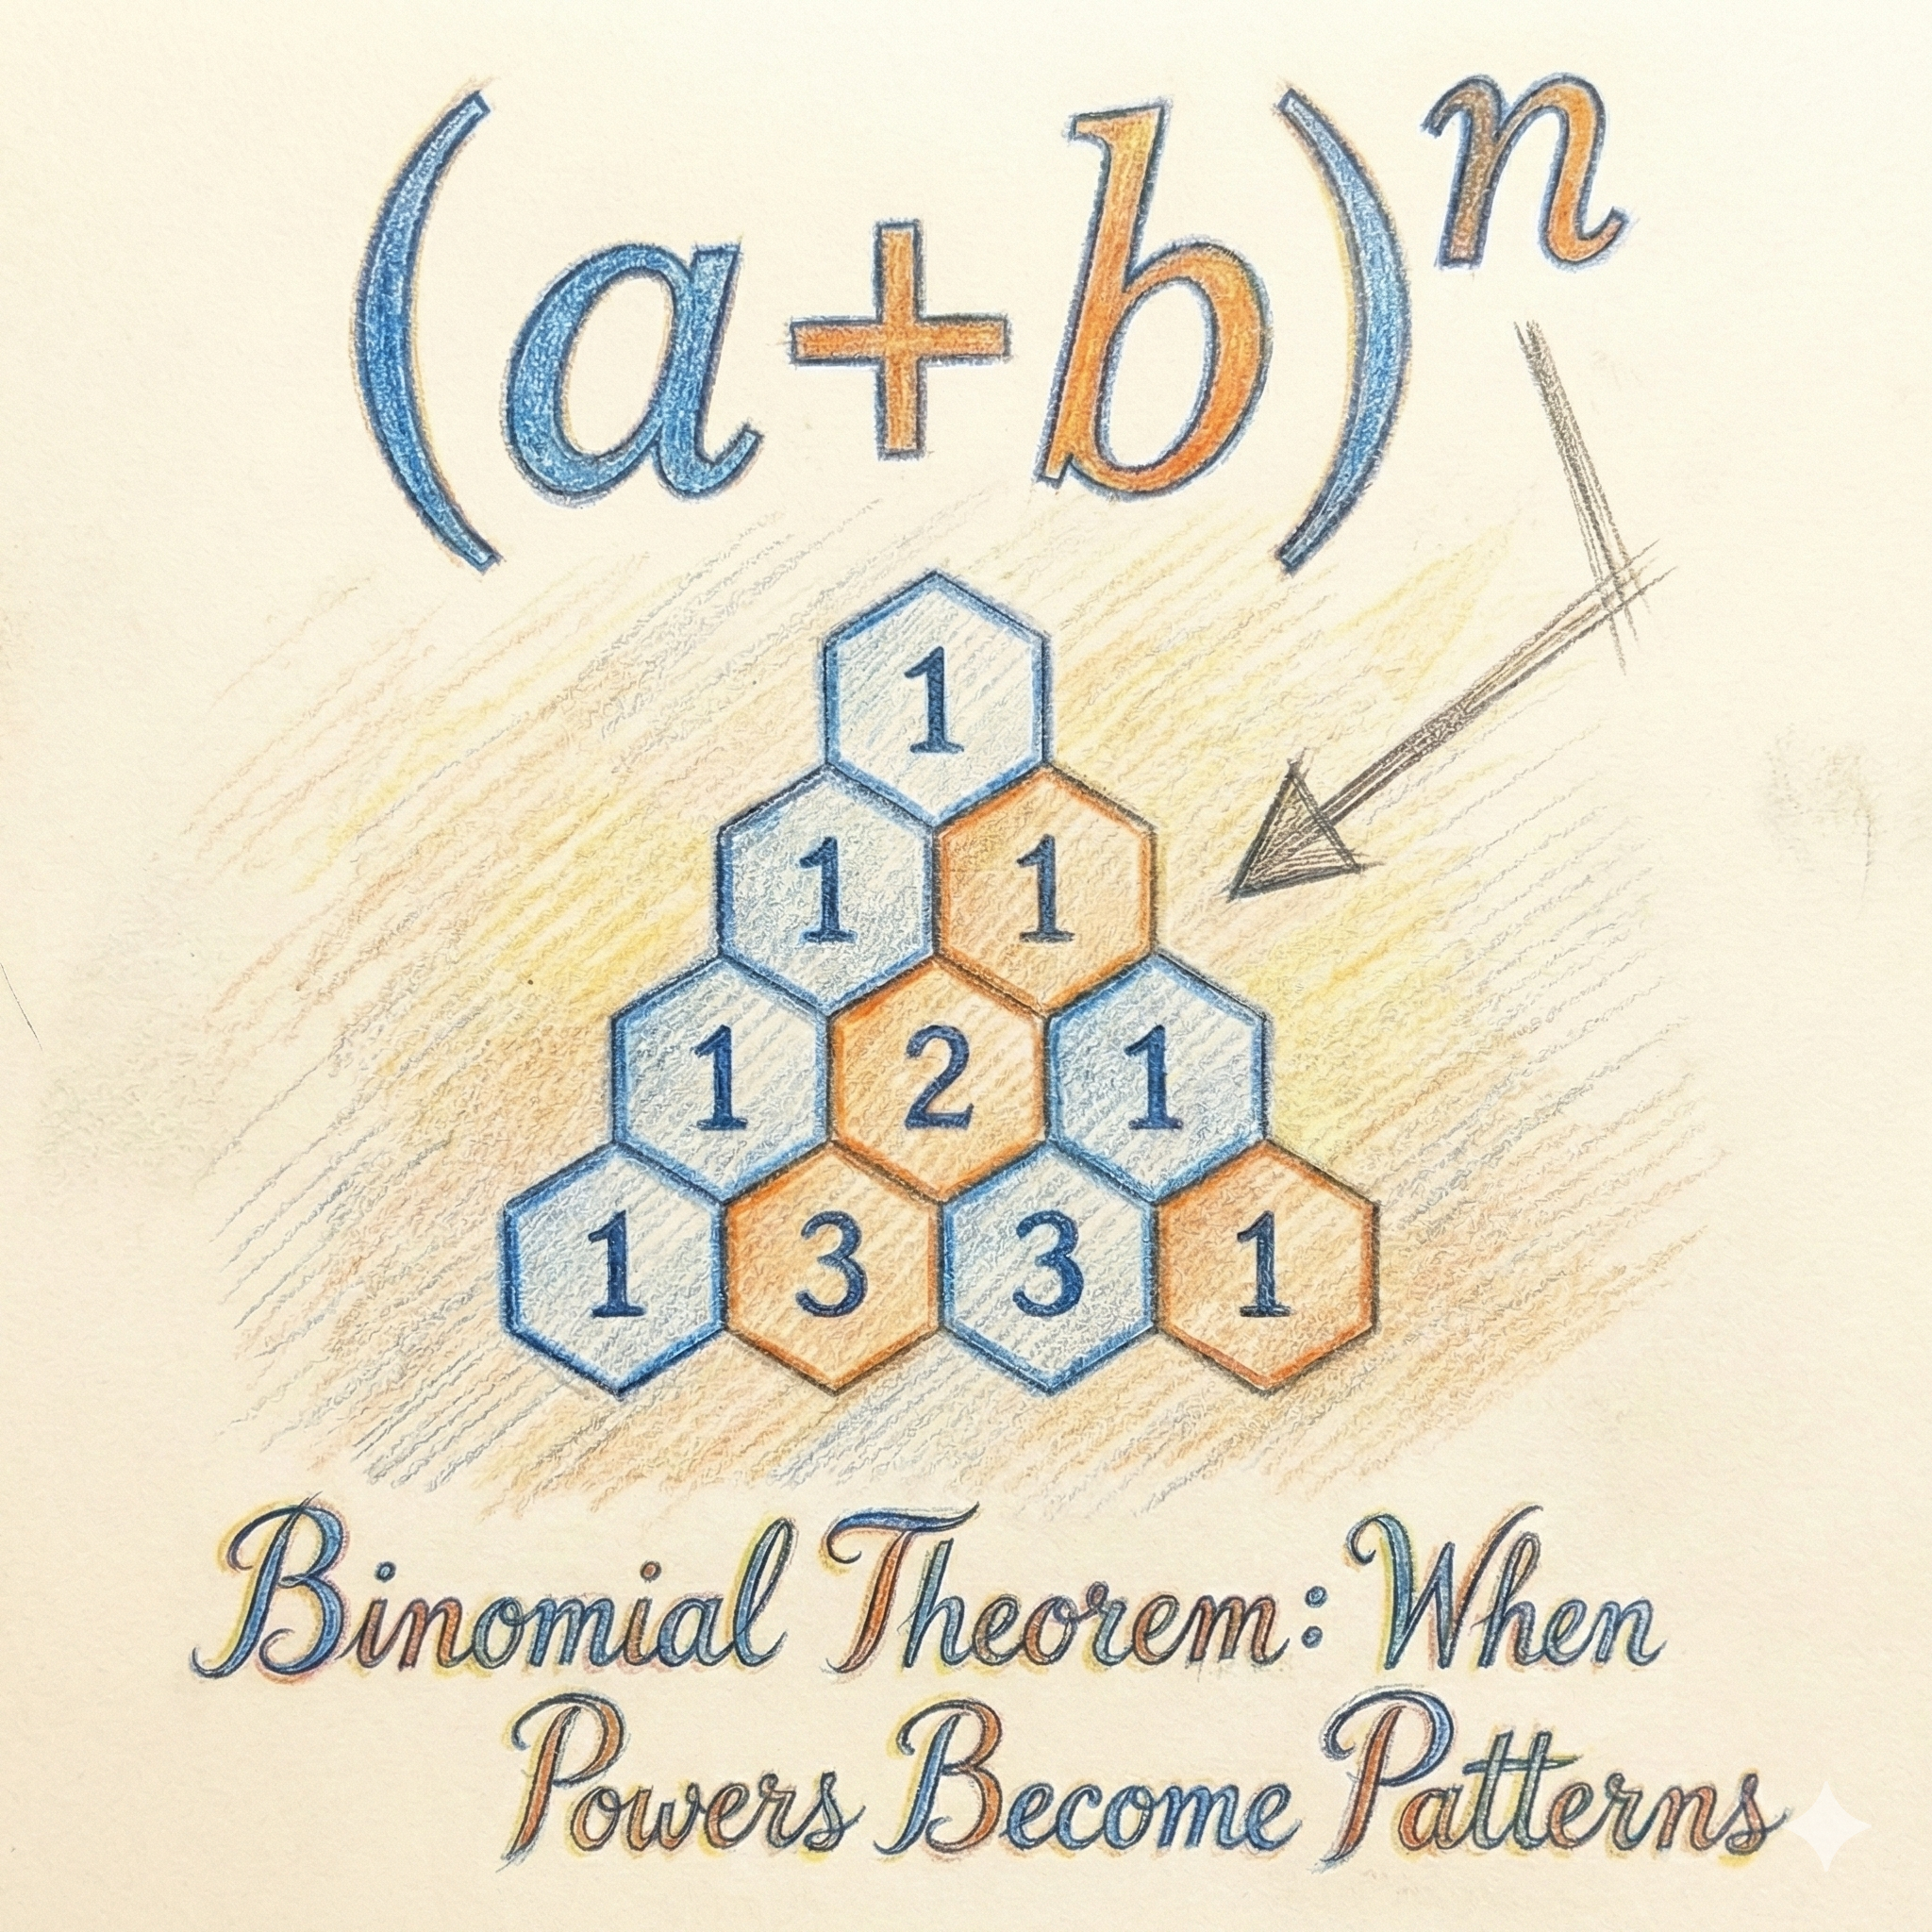
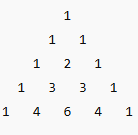
Let’s see how the Pascal triangle helps us get to (a + b) ^ n by simply building a pattern, as if the child is playing with numbered Duplo blocks. The simple yet powerful pattern is built by addition. We start with a single 1 at the top, and each new row begins and ends with 1; Every number between these two 1s is the sum of the two numbers directly above it.
Now let’s connect it to maths.
Each row corresponds to the coefficients of (a + b) ^n
- Row 0 → 1→ (a + b) ^ 0 = 1
- Row 1 → 1, 1 → (a + b) ^ 1 = a + b
- Row 2 → 1, 2, 1 → (a + b) ^ 2 = a^2 + 2ab + b^2
- Row 3 → 1, 3, 3, 1 → (a + b) ^ 3 = a^3 + 3a^2b + 3ab^2 + b^3
- Row 4 → 1, 4, 6, 4, 1 → (a + b) ^ 4 = a^4 + 4a^3b + 6a^2b^2 + 4ab^3 + b^4
This is not a magic! Each entry in Pascal’s Triangle represents a binomial coefficient nCk
nCK = the kth number in row n of Pascal’s Triangle.
So when you see the triangle, you’re really looking at the entire binomial world—every possible way to choose k elements out of n.
Now, let’s see it algebraically.
Let’s start simple:
= (a + b)(a + b)
If we multiply it out, we get:
a^2+ab+ba+b^2
Notice that the middle terms “ab” and “ba” are the same product, so we combine them:
a^2+2ab+b^2
Now, that 2 in front of ab didn’t appear out of nowhere—it tells us that when we expand (a + b)^2 = (a + b)(a + b), there are two distinct ways to get one a and one b:
- The first a from the first bracket and b from the second, or
- b from the first bracket and a from the second.
That’s exactly what the binomial coefficient (21) represents — “2 choose 1,” or the number of ways to choose one position for b and the remaining one position for a
So the expansion follows the binomial theorem pattern:
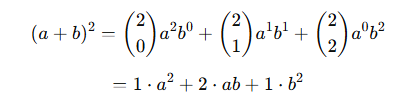
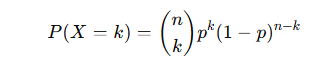
This leads to the Binomial Theorem, which states:
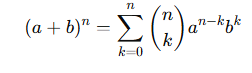
After understanding this concept , one never has to remember any formula for ( a + b ) ^ n!
Binomial Coefficient
Now you must have noticed nCk and you are either so proud of yourself that you know how to solve it or you are just wondering how to solve it, in any case understanding the following concept of binomial coefficient is very important so you don’t end up memorizing the formula and have a better use of the memory like remembering birthday of your loved one!
Let’s walk through a simple example to understand the binomial coefficient — the mathematical expression used to determine how many ways we can choose items from a set, regardless of the order, that is, a combination, right?
Example: Choosing 2 letters from {A, B, C}
We want to find the number of ways to choose 2 items from the set {A, B, C}.
Binomial representation is:
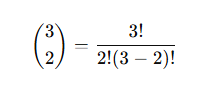
Step 1: Understanding the Total Arrangements (Numerator)
The numerator 3! represents the total number of ways to arrange all 3 items:
3! = 3 × 2 × 1 = 6
So, there are 6 possible ordered arrangements of {A, B, C}:
(A, B, C)
(A, C, B)
(B, A, C)
(B, C, A)
(C, A, B)
(C, B, A)
These are permutations, not combinations, as we have listed all possible orders of the combination of three letters. However, we are just looking for combinations, and we are interested in choosing 2 letters from {A, B, C}, ignoring the order of those two letters.
Step 2: Eliminating the repetitive arrangements (denominator)
Since we’re just picking, not ranking, we need to eliminate the repetitions.
So 2! In the denominator is accounted for the 2 letters; we could have chosen a permutation, for example, we select 2 letters A and B, we can arrange them in 2 ways (A, B) and (B, A), so we are just eliminating that.
Then comes (3 – 2) ! in the denominator, Which accounts for the letter we haven’t chosen, for example, out of three letters{A, B, C}, we have chosen A and B, so that will be (3 – 2)!, and that is just one remaining letter C, so it will be 1!
So final denominator calculation will be
2! X (3 – 2)! = 2! X 1! = 2
Step 3: Computing the Binomial Coefficient for choosing 2 letters out of 3:
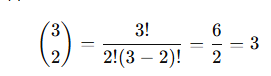
So, there are 3 distinct ways to choose 2 items from 3.
So distinct combinations are just groups of two letters without following any order.
{A, B}
{A, C}
{B, C}
Example : Probability of getting 2 tails in 5 coin flips
Imagine you flip a fair coin five times. What’s the probability that you get exactly two tails?
Step 1: Understand the problem
This is a binomial probability problem
Each coin flip is independent, and every flip has two possible outcomes: Head or Tail.
Here’s what we know:
- Number of trials: n = 5
- Probability of getting a Tail (our “success”): p=0.5
- Number of successes we want: k = 2
In short, we want:
P(X = 2)
Step 2: Use the binomial formula
Plug in the values:
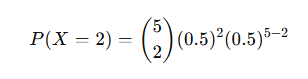
Step 3: Do the math
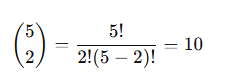
First, calculate the number of ways to get 2 tails out of 5 flips
Let’s compute the probability of any one sequence with exactly 2 tails and 3 heads
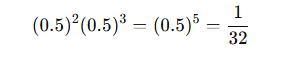
Let’s multiply them
So, the probability of flipping exactly two tails in five tries is 5/16 = 0.3125, which says there is a 31% chance of getting two tails in five tries.
If you tried this experiment many times, you’d expect roughly 31 out of every 100 five-flip sequences to show exactly two tails.
The Intuition
total possible outcomes 2^ 5 = 32
total possible combinations: 5 C 2 = 10
probability = total possible combinations / Total possible outcomes = 10 / 32 = 5/16 = 0.3125
Expected Value of a Binomial Distribution
The expected value of a binomial distribution tells us what we’d get on average if we repeated the experiment many times. For a binomial random variable X with n trials and success probability p, the expectation is:
E[X]=n × p
It’s that simple — multiply the number of trials by the probability of success. So, if you flip a fair coin 5 times (n=5,p=0.5), you can expect 5×0.5=2.5 tails on average. You’ll never actually see “half a tail,” but this value captures the long-run average over many experiments — the mathematical heartbeat of probability.
Email Campaign Probability: A Binomial Perspective
If an email campaign has a 10% click rate, how many clicks can you expect from 50 emails?
Does it follow binomial assumptions? Let’ see
- Fixed number of trials (50 emails).
- Two outcomes: clicked or not clicked.
- Constant probability (10%) assumed.
- Independence is reasonable if recipients don’t influence each other’s behaviour.
Here n = 50, p = 0.10
So E[X] = n x p
= 50 x 0.10
= 5
On average, if you repeatedly ran similar email campaigns, you would expect about 5 clicks out of every 50 emails you send.
Here, the number 5 comes from the long-run average predicted by the binomial distribution — not a guaranteed outcome for a single campaign.
Variance of a Binomial Distribution
While the expectation tells us the average outcome, the variance tells us how much the results tend to vary around that average. For a binomial random variable x with n trials and success probability p, the variance is:
Var(X) = n × p × (1−p)
It’s a neat expression that balances how often we try (n), how likely success is (p), and how likely failure is (1−p). For example, if you flip a fair coin 5 times, the variance is 5×0.5×0.5=1.25. The higher this number, the more unpredictable your outcomes — Statistical metaphor for the phrase “expect the unexpected.”
The binomial distribution beautifully captures the essence of chance in simple, repeatable experiments — like coin flips, dice rolls, or success/failure trials. From counting combinations to finding probabilities, expectation, and variance, it shows how randomness still follows elegant patterns. Whether you’re calculating the odds of two tails or predicting long-term averages, the binomial framework turns uncertainty into structure ; just like finding rhythm in cacophony!
However, it’s also important to remember that real-world data doesn’t always obey the binomial assumptions perfectly: probabilities may shift over time, trials may influence each other, and independence isn’t always guaranteed. Still, the binomial model offers a powerful starting point for understanding and approximating complex predictions.