When we watch cricket, we don’t just see sixes flying and wickets tumbling — we see so many numbers. Averages, strike rates, dot balls, boundaries… it’s like the scoreboard is a math exam. But hidden inside those numbers are patterns that tell us who’s consistent, who’s risky, and who’s just having a lucky day.
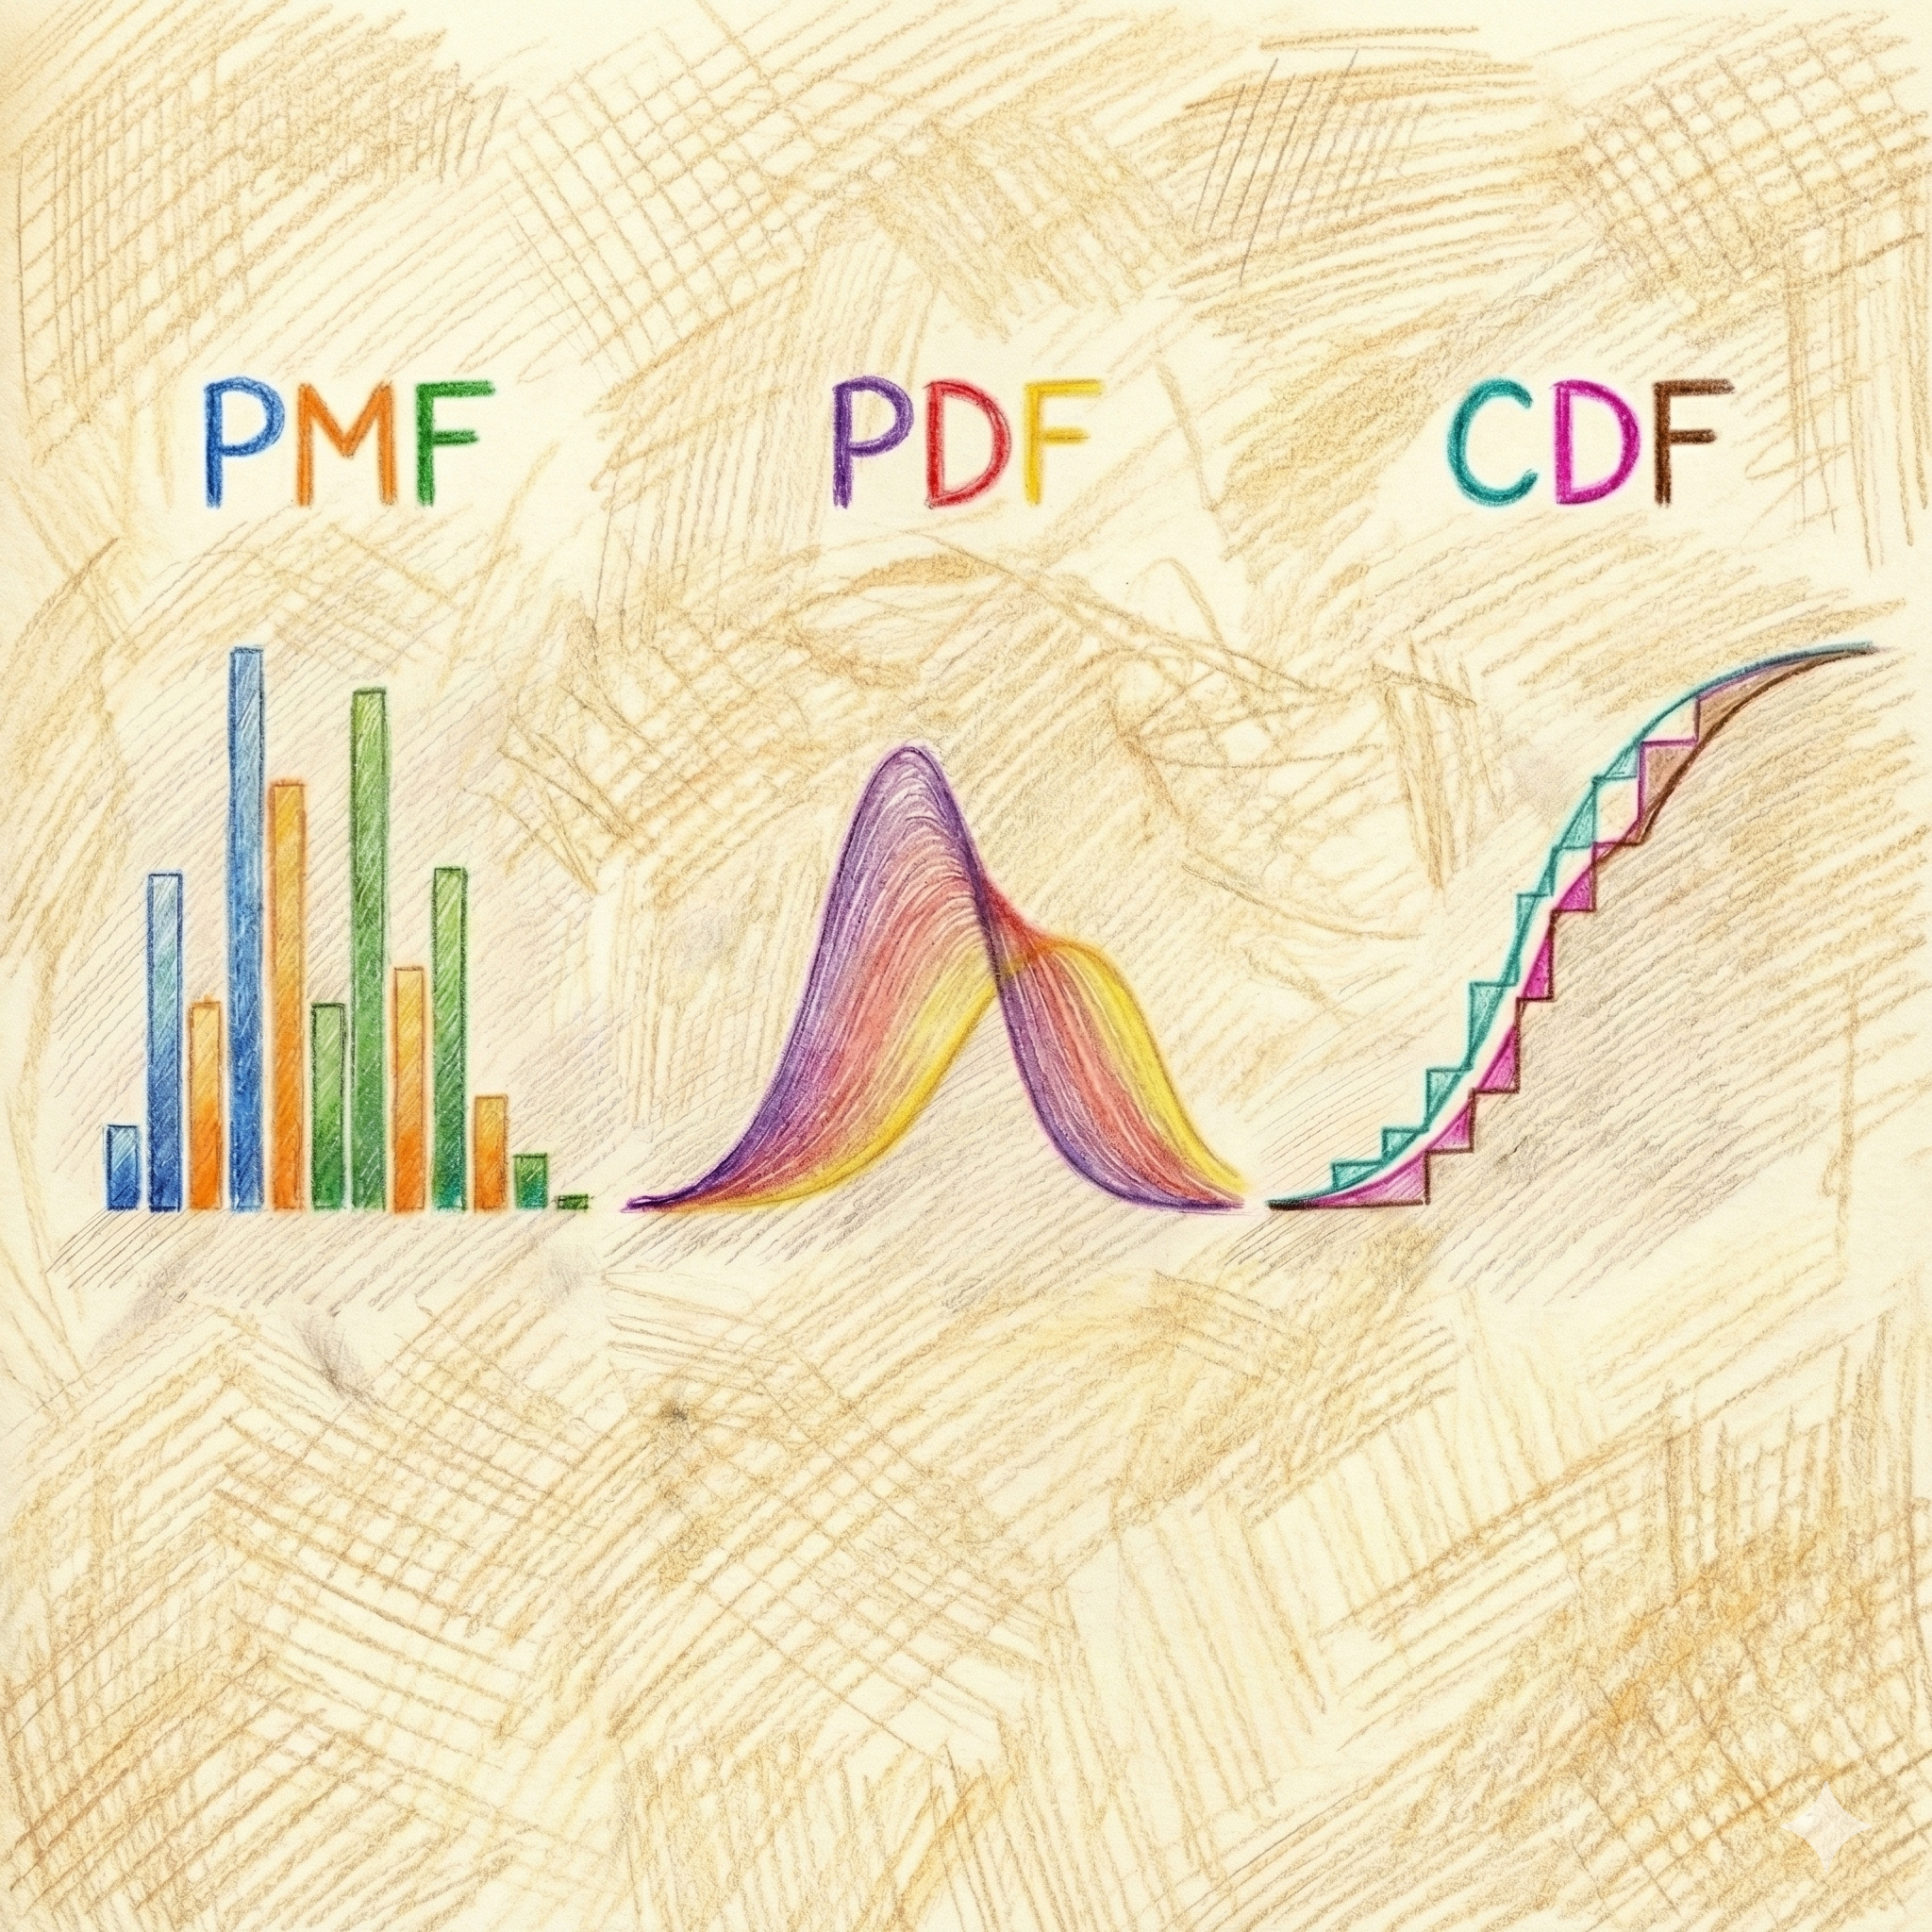
One of the coolest concept to understand these patterns is , the Probability Distribution Function (PDF). It’s a way of saying: “What are the chances this batsman scores big or gets out for a zero next time?”
So let’s understand PDF using the simple example of a cricketer’s career statistics.
Frequency Distribution vs. Probability Distribution
Frequency Distribution:
Imagine you’re analyzing Virat Kohli’s Career Statistics.
- Total innings = 290
- 50s = 74
- 100s = 51
- 50+ total = 125
- 0s = 16
That’s a frequency distribution — it tells us how often each range of runs happened in the past.
Probability Distribution:
Instead of just counting history, a probability distribution answers: “If Virat Kohli walks out to bat again, what is the chance he’ll score in each range?”
Probability Distribution (per innings)
- 0s : 16 ÷ 290 ≈ 5.52%
- Score 50–99 (fifty): 74 ÷ 290 ≈ 25.52%
- Score 100+ (century): 51 ÷ 290 ≈ 17.59%%
- Other scores (1–49, not 50+): (290 – 125 – 16) ÷ 290 = 149 ÷ 290 ≈ 51.37%
That’s a probability distribution — a model of uncertainty about the future, not just a description of the past.
A frequency distribution is basically the scoreboard of what actually happened. It’s like saying, “In the last 10 cricket matches, our opener got out for a zero 3 times, hit a half-century 4 times, and scored a century 3 times.” It’s the history book.
A probability distribution, on the other hand, is more like a fortune-teller — it lists the chances of all the things that could happen if the game (or experiment) were played again. Instead of just saying what happened, it says, “Next match, there’s a 30% chance he’ll score under 10, a 40% chance he’ll hit a decent knock, and a 30% chance he’ll score a century.”
Because probability distribution deals with expectations, It is the best choice, when making decisions under uncertainty. It doesn’t give guarantees, but it whispers, “Here’s what’s most likely.” And it’s not just cricket or fun games. Even serious industries run on this. Think about insurance companies: their actuaries don’t just spin a wheel to decide our premium. They use mountains of data — decades of death rates, health patterns, and age brackets — to estimate the probability of someone living to 80 or not. In other words, our premium isn’t pulled out of thin air… it’s pulled out of a probability distribution (which sounds slightly less magical, but way more reliable).
What a Probability Distribution Is (and Is Not)
- It is a rule that assigns probabilities to different outcomes.
Example: “There’s a 20% chance the batsman scores a half-century in his next match.” - It IS NOT a guarantee.
Even if the model says 20%, he might score 50+ three games in a row — probability is about long-term patterns, not certainties for a single game. - It is a simplification.
Instead of predicting every tiny possibility, we group outcomes into a pattern we can reason about.
So, why does all this matter? Where will you use this concept? well , here you go
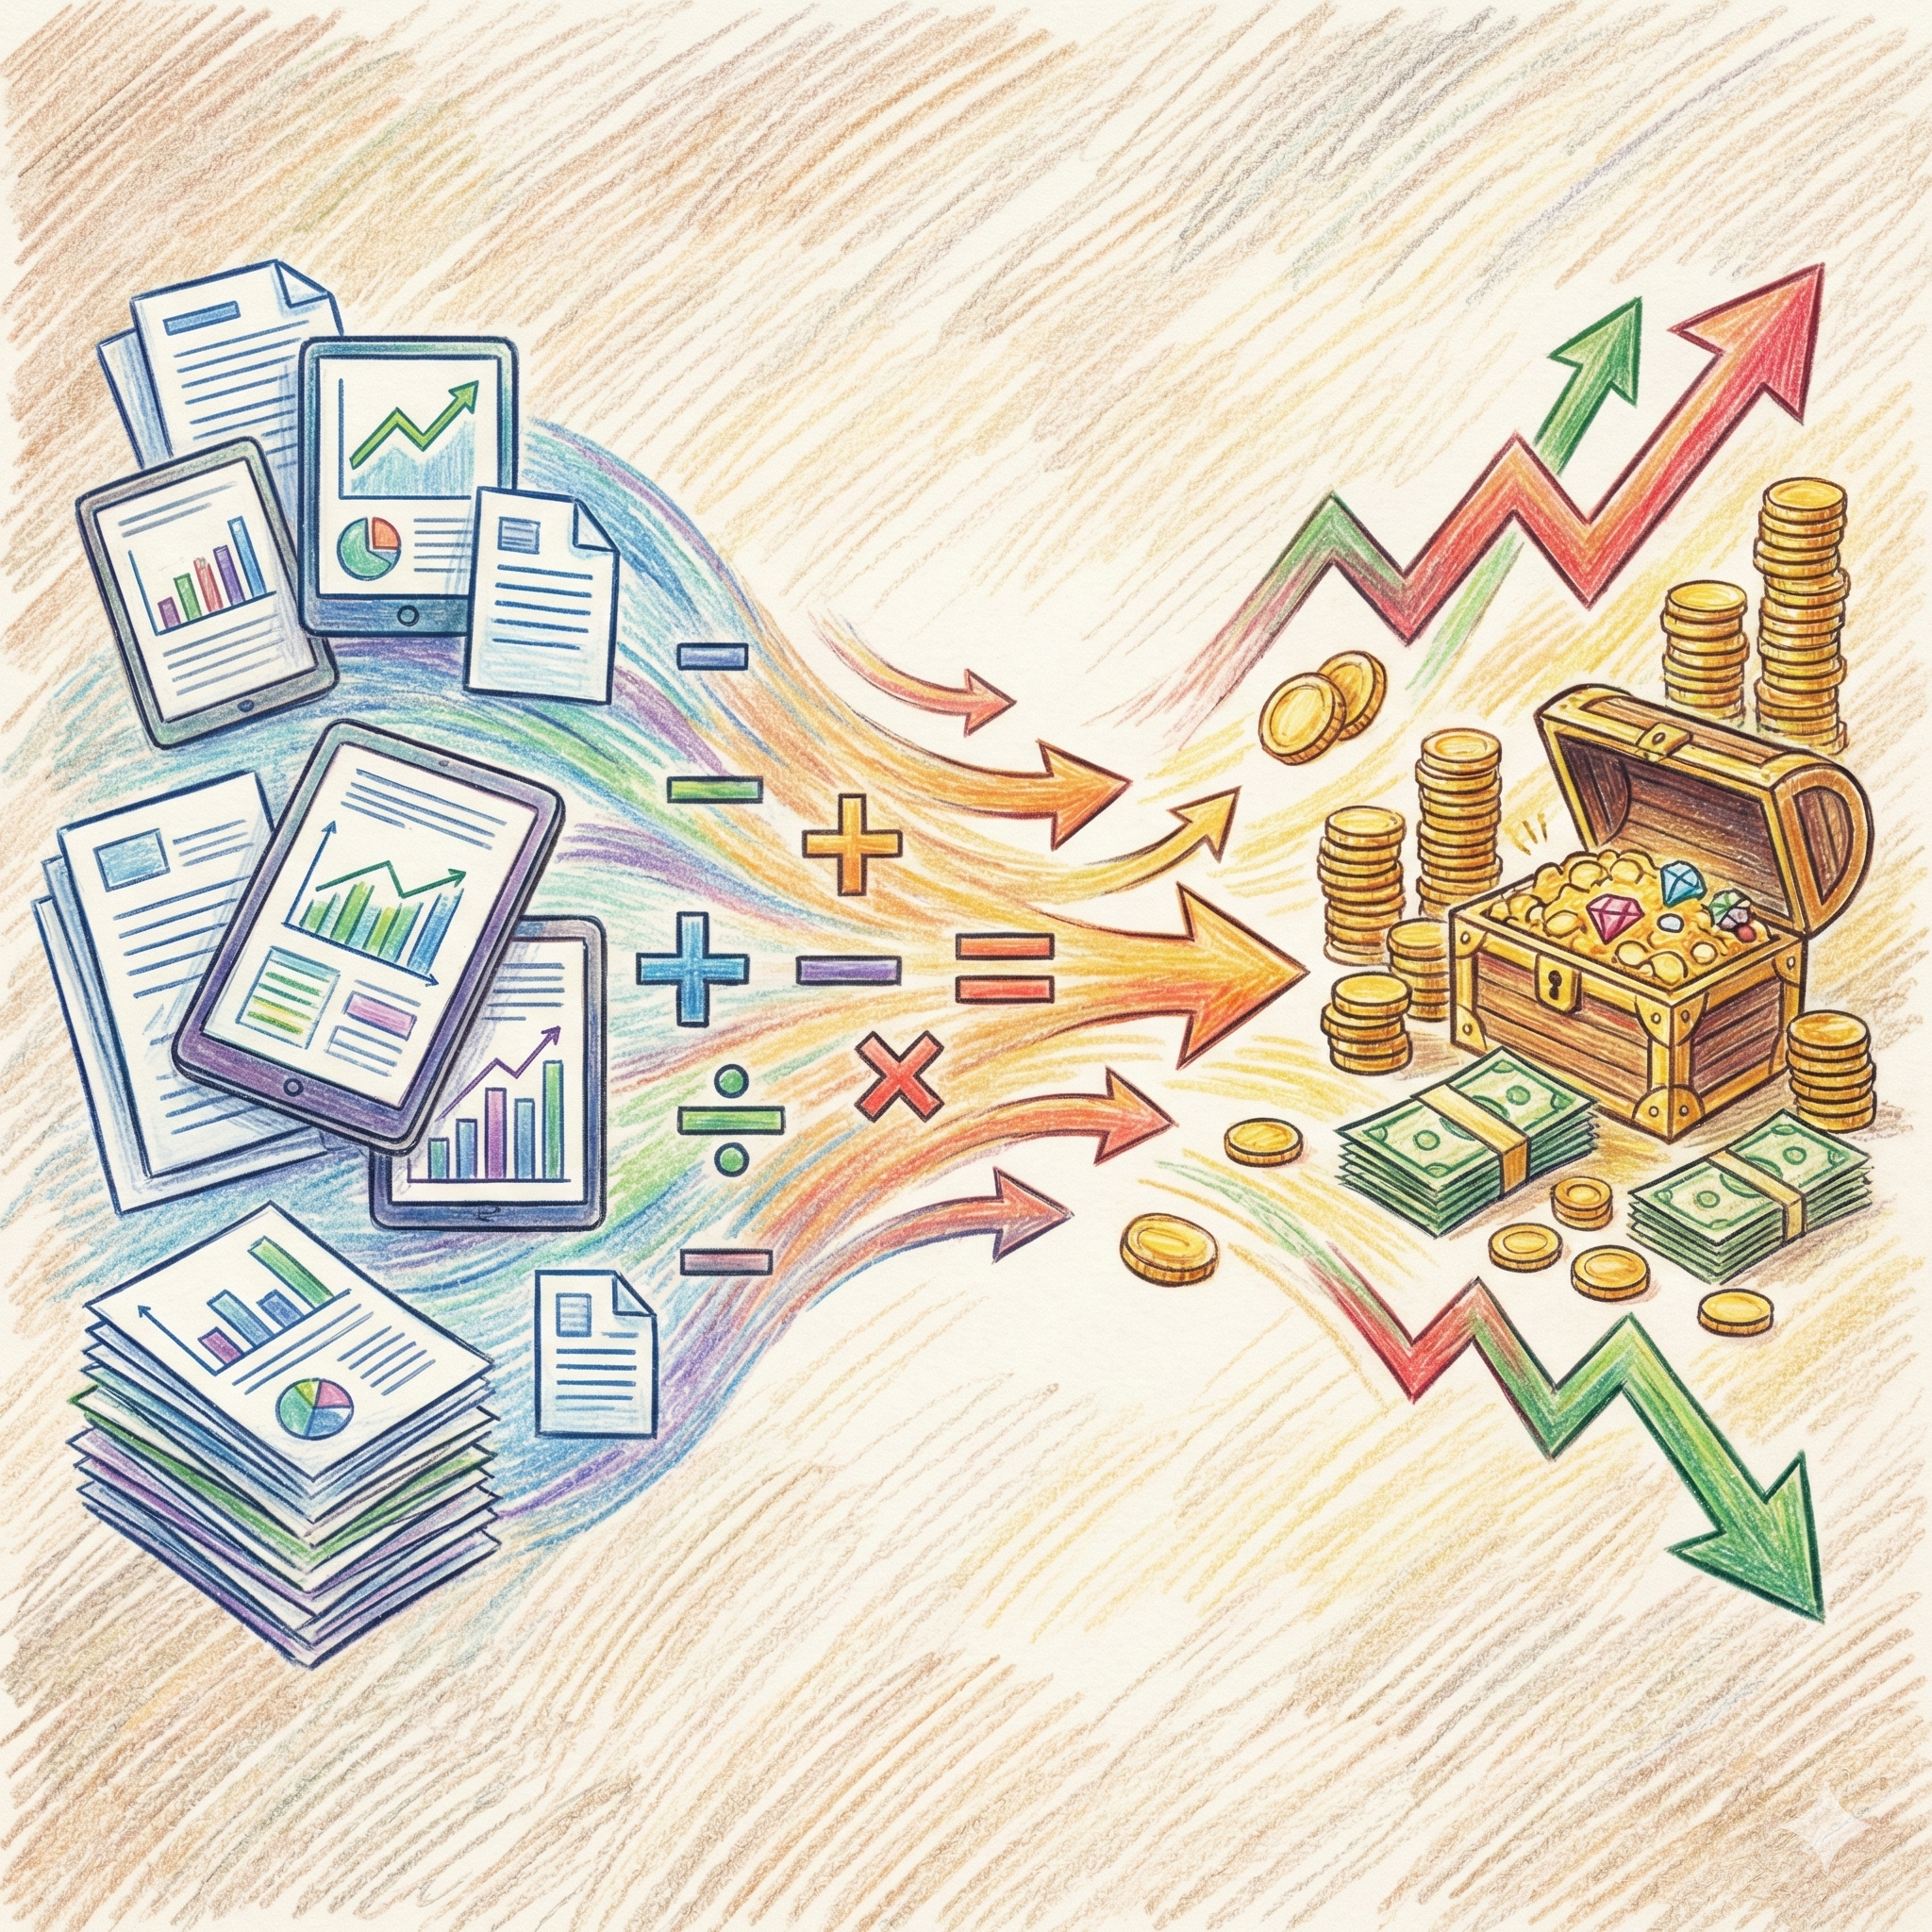
- Forecasting: They give us a sneak peek into the future instead of just replaying highlights from the past.
- Risk Management: They help businesses juggle the odds of profit and loss
- Decision Making: From planning ad campaigns to deciding how much stock to keep in the warehouse, they make “what if” thinking a lot less a guess work.
In short, probability distribution helps us in decision making under uncertainty. And in the next article, we’ll take them from the cricket ground to the Profit and loss sheet — exploring how they shape business decision-making. Think of it as the warm-up before we step into the big league of decision theory.