In 2010, a Harvard Business School study on “power posing” made headlines worldwide. The researchers reported that simply standing in confident, expansive postures for two minutes could increase testosterone levels, lower cortisol, and make people more likely to take risks — all with a statistically significant p-value below 0.05 (source). The idea soon went viral, spreading across TED Talks, business storytelling, and popular media. However, a few years later, multiple large-scale replications — including Ranehill et al. (2015)(source) and Simmons & Simonsohn (2017)(source) — failed to reproduce exactly the same effects. As Power posing has an effect on self-reported feelings of power, however, there is no significant effect on hormone levels or behavioural tasks. It just turns out that statistical significance can make weak effects appear heroic.
The p-value tells us how surprising our data are if the null hypothesis were true — not how likely the null itself is true. It’s the probability of seeing results this extreme just by chance. A low p-value is like your smoke alarm starting to ring: maybe there’s a fire, or maybe your partner just burned the toast! In statistics, it simply measures how unusual your data would be in a world where nothing’s really happening.
Common Mistakes to Avoid Regarding p-value:
Mistake 1: P-value is not the probability that the null hypothesis is true:
A p-value doesn’t tell you how likely the null hypothesis is true, though most of the researchers secretly hope for that. P-value is not the Bayesian probability.
Example:
You walk outside and see the wet ground, you wonder, “Did it rain?”
The p-value is asking, “if it hadn’t rained, how likely is it that the ground would be still this wet?”
It is not a Bayesian question like, “Given the wet ground, how likely is it that it rained?”
Mistake 2: Confusing 1-p-value with a Confidence Interval:
P–value:
If the P-value is 0.03, that doesn’t mean that you are 97% confident about your result; it simply means that assuming null hypothesis is true, you see a result as extreme as this under the given circumstances. There is only 3% chance that you will see it just as a random effect.
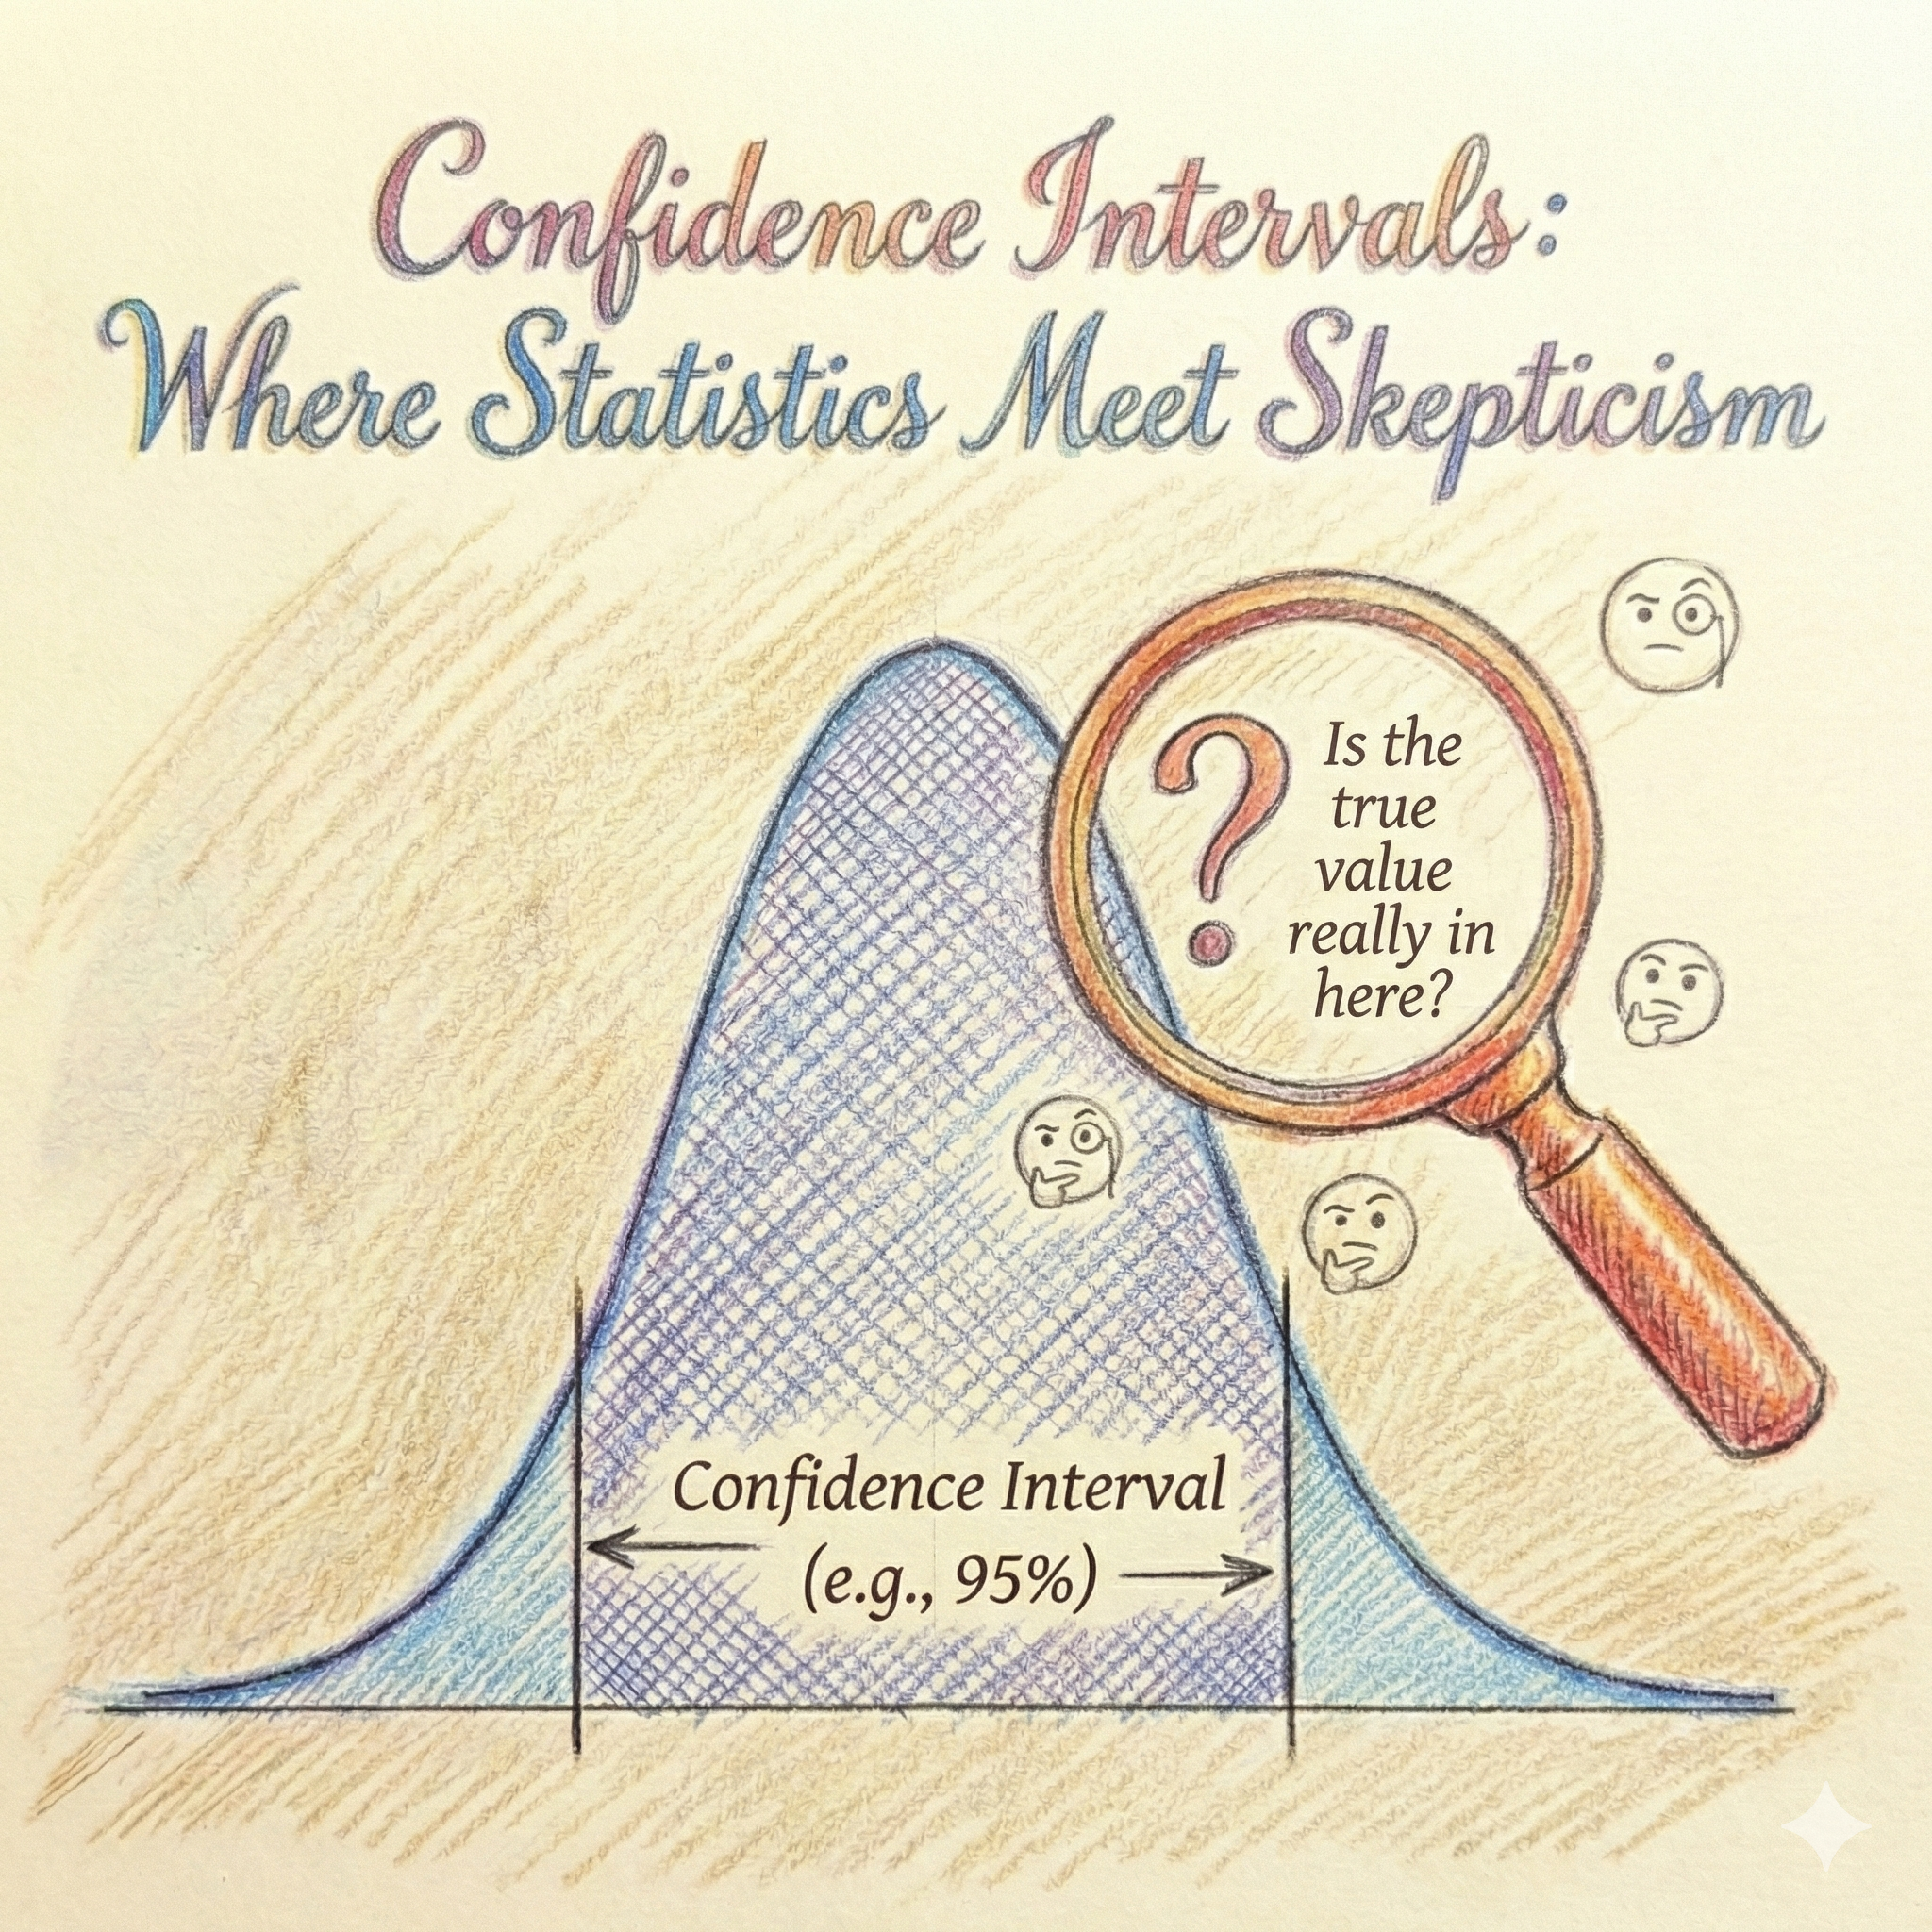
Confidence Interval:
Let’s say if your confidence level is 95%, that is the interval you used to define the range, and it is not because of one single p-value. A 95% confidence interval means, if you ran the test 100 times, about 95% of those confidence intervals would include the result.
Example:
The p-value is like saying:
“If most people on this app aren’t into poetry, how surprising is it that I just matched with someone who quoted some lines of W.B. Yeats in the bio?”
It tells you how unexpected your match is, assuming the usual trend holds true—not whether your match is “the one.”
The confidence level is like saying:
“My match algorithm gets it right 95% of the time—when it says we’re compatible, we usually are.”
It reflects how often the matching method works well—not how certain you should be about this particular match.
Mistake 3: P-value < 0.05 is not the Proof:
A p-value less than 0.05 doesn’t mean anything has already been proven, it simply means that the data are unusual enough to blame the chance alone.
Example:
I saw footprints in the snow in preschool garden.
A little girl tells me, “Fairies must’ve visited!”, It is her significant result p < 0.05, because she is too little to think of other scenarios. Here, for her the evidence looks convincing, but she is still wrong.
But I know those footprints aren’t proof of a fairy visit, it may be footprints of the other child from the school, or may be an animal passed by.
Statistically p < 0.05 means,If nothing unusual was happening ( no child walked, no animal walked), I would only expect to see data like this 5% of the time. That’s not the proof though. Proof means ruling out all other explanations, repeating the experiments and seeing the same result again and again under different conditions.
Mistake 4: Focus solely on the p-value , while ignoring the effect size:
Many people get so caught up chasing a low p-value that they forget to ask the real question: does it actually matter? The p-value only tells you if a result is likely real, not if it’s worth caring about. With a big enough sample, even tiny, meaningless differences can look “significant.” On the flip side, a truly important effect might slip under the radar if the sample’s too small. So don’t stop at the p-value — always check the effect size to see how big the story really is. (More on effect size in next blog…)
Before we dive headfirst into formulas (don’t worry, that splash is for the next article), let’s first see what a p-value looks like in action.
The curve below shows a sampling distribution — basically, all the test statistics you’d expect if the null hypothesis were true.
The red shaded tails mark the 5% of outcomes that would be rare enough to make us raise an eyebrow (p < 0.05).
The dashed blue line shows an observed test statistic from our data.
If that blue line lands deep inside the red zone, it means our result would be pretty unlikely if the null hypothesis were true — but remember, unlikely is not the same as impossible.

That’s the whole story of the p-value: it doesn’t prove the effect is real; it just tells us how surprising our data would be in a world where nothing’s happening. A small p-value is a clue — not a confession. It signals that your data are unusual under the assumption of no effect, but it doesn’t prove anything on its own. Like footprints in the snow or a whisper in the woods, it invites curiosity, not certainty. Scientific conclusions require more than statistical surprise — they demand replication, context, and careful reasoning. So when you see p < 0.05, treat it as the beginning of a conversation, not the end of an investigation.
Try Interactive visualization, Please drag the blue line (or use slider) to move your observed result.
🔔 The p-Value Explorer
A low p-value is a clue — not a confession.