Remember sitting in math class, doodling in your notebook while the teacher kept repeating “y = mx + c”? At the time, it felt like just another formula to memorize, but it was more than that, Here’s one more chance to grow up with it again — but this time in a relaxed and fun way. No tests, no chalk dust — just clear ideas. And why bother? Because this little equation isn’t just classroom trivia; it’s the backbone of spotting patterns, predicting trends, and making smarter decisions in business and beyond.
Understanding the Equation of a Line: y = mx + c
One of the simplest yet most powerful equations in mathematics is the equation of a straight line, written as:
y=mx+c
This equation captures every possible straight line on a two-dimensional plane. The two constants, m and c, determine exactly how the line looks:
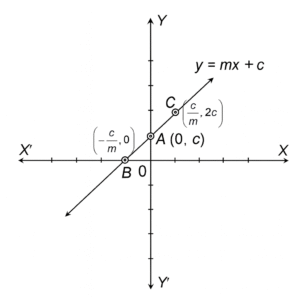
- c (the intercept): where the line crosses the y-axis. In the graph, that’s point A(0, c).
- m (the slope): the tilt of the line, showing how steeply it rises or falls.
Deriving the Key Points on the Line
The general equation of the line is:
y = mx + c
1. Point A (0, c) — The Y-intercept
To find where the line cuts the y-axis, we set x=0
y=m(0) + c = c
So the y-intercept is: A(0,c)
2. Point B (−c/m,0)— The X-intercept
To find where the line cuts the x-axis, we set y=0
y = mx + c
mx + c = 0
⇒ mx = −c
⇒ x = -c/m
So the x-intercept is: B(−c/m,0)
The Intercept (c) :
As I mentioned earlier, intercepts help us identify where a line meets each axis. The x-intercept is where the line crosses the x-axis, and the y-intercept is where it crosses the y-axis. Now, let’s examine what happens when we change the value of c in the equation y = mx + c. If c increases, the entire line shifts upward. If c decreases, the line moves downward. A simple analogy is an elevator — think of c as the floor number.
- If c increases, you are on a higher floor.
- If c decreases, you are on a lower floor.

The Slope(m) :
The slope of a line in the equation y = mx + c represents how steep the line is and indicates the rate at which the y-value changes with respect to the x-value. A positive slope means the line rises as x increases, while a negative slope means the line falls as x increases. The greater the absolute value of the slope, the steeper the line appears. If the slope is zero, the line is perfectly horizontal, showing no change in y as x changes. In essence, the slope defines the direction and steepness of the line.
When it comes to slope, imagine the line as a road — the slope reflects the incline you experience while driving.
- A positive slope is like driving uphill — as you move forward (x increases), you climb higher (y increases).
- A negative slope is like coasting downhill — move forward, but your height drops.
- A zero slope is the flat highway — steady, no rise or fall.
So yes — math class might have felt like endless chalk dust and doodles. But your second chance to “grow up” with y = mx + c might be little less boring. This time, you get to see it not as a formula to memorize, but as a simple story of tilt (m) and starting point (c) — a story that shows up in data, decisions, and everyday life. Since every story has more than one way to be told, our next stop will be the different forms of the equation of a line — slope-intercept, point-slope, and more —each one framing the same simple idea in its own way, making it easier to see how math speaks different ‘dialects’ in real life.
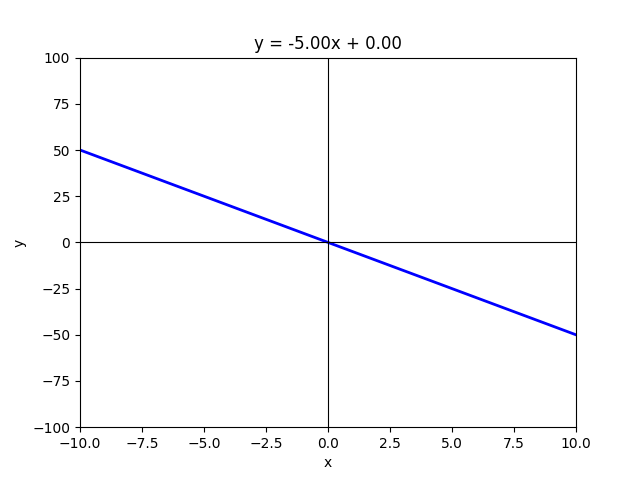
📐 Straight Line Explorer
Slide, drag, and toggle to see what makes a line a line.